Who Competes with Whom? Mapping Hong Kong's Financial Competitor Network from Labour Market Data
Who Competes with Whom? Mapping Hong Kong’s Financial Competitor Network from Labour Market Data
When Citadel loses a portfolio manager to Point72, both firms understand the competitive stakes. The SFC register records when the licence at Citadel was cancelled and when a new one at Point72 was activated. The gap between them is a legal mechanism (the non-compete clause) but also a data signal. For moves between rival hedge funds, 13% of professionals wait more than a year before their next licence activates. This post is about what that signal, aggregated across thousands of transitions over 20 years, reveals about competitive structure in Hong Kong’s financial industry.
tl;dr Using 20 years of regulatory data from Hong Kong’s Securities and Futures Commission (SFC), we construct a firm-firm competitor network for approximately 5,000 financial companies, without relying on self-reported disclosures or analyst judgment. The key insight: when employees move between firms, they leave a behavioural trace of competitive relationships. But not all moves are equal. A move from Goldman Sachs to a hedge fund is career progression; a move from Citadel to Point72 is genuine rivalry. We identify 315 hedge funds, trace 918 person-transitions between them, and map a competitor network of 2,387 firms with 14 distinct communities.
Context: The problem with competitor data
Commercially available competitor datasets are either self-reported (a company says who it thinks competes with it) or constructed by analysts based on SIC codes and business descriptions. Both approaches have well-known limitations: self-reported data reflects strategic disclosure choices rather than ground truth, SIC codes are coarse proxies for actual business overlap, and private firms (which make up the vast majority of Hong Kong’s financial industry) are largely invisible to both methods.
This project started from a simple observation: Hong Kong’s Securities and Futures Commission publishes a complete, public register of every licensed financial professional since 2003, including name, firm, regulated activity types, and the exact dates their licence was active. If you know when a person was at Firm A and when they joined Firm B, you have a behavioural signal of competition that would be invisible otherwise. Firms compete for the same talent precisely because they do the same thing.
This builds directly on two prior papers: Mapping Hong Kong’s Financial Ecosystem (which used the same register to study the network structure of licensed professionals and firms) and Turnover Contagion in HK Financial Labour Markets.
Data: 519,860 licence records, 20 years, 5,000 firms
The SFC register contains 519,860 licence records spanning 2003–2024, covering 121,883 unique persons and 4,979 distinct firms. Each record specifies the regulated activity type (RA1 through RA10):
| RA | Description |
|---|---|
| RA1 | Dealing in Securities |
| RA2 | Dealing in Futures Contracts |
| RA4 | Advising on Securities |
| RA6 | Advising on Corporate Finance |
| RA9 | Asset Management |
| RA10 | Providing Credit Ratings |
Large financial groups typically appear as multiple distinct legal entities in the register: Goldman Sachs (Asia) L.L.C., Goldman Sachs Futures Co. Ltd., and Goldman Sachs Private Wealth Management Ltd. are three separate SFC registrants, but treated as a single competitive entity in our analysis. We consolidate these into 4,576 parent entities using Claude Haiku to identify ultimate parent relationships, followed by two targeted merge passes based on inspection of the highest-similarity pairs. All analysis from this point forward operates at the parent-entity level.
Methodology: Three signals, one score
We construct the competition score between every pair of parent entities as a weighted combination of three signals. Each captures a fundamentally different dimension of competition and they are not interchangeable.
\[C[i,j] = 10 \times \left( \frac{1}{3} \cdot \tilde{J}[i,j] + \frac{1}{3} \cdot \tilde{F}[i,j] + \frac{1}{3} \cdot \tilde{E}[i,j] \right)\]Signal 1 — Activity Overlap (Jaccard): potential competition
For each parent entity, we compute a binary vector over the 10 regulated activity types. The Jaccard similarity between two firms measures the overlap of their regulatory footprints:
\[J[i,j] = \frac{|A_i \cap A_j|}{|A_i \cup A_j|}\]Two firms that both hold RA1, RA4, and RA9 score J=1.0. This is a structural signal: do these firms operate on the same regulatory fields? It has full coverage (computable for all 8.3M pairs) and is stable over time. Its main limitation is coarseness: a Chinese retail broker and a global investment bank both hold RA1, but they serve entirely different clients.
Signal 2 — Normalised Employee Flow: revealed competition
For each person, we detect sequential transitions: a tenure at Firm A ending within a window of a tenure at Firm B starting. We aggregate and normalise by firm size:
\[F[i,j] = \frac{\text{flow}_{i \to j} + \text{flow}_{j \to i}}{\sqrt{n_i \cdot n_j}}\]This is a behavioural signal: do firms actually compete for the same people? It is observable from the public register regardless of whether either firm chooses to disclose competitive relationships.
The key methodological choice is the transition window. We use 730 days (2 years) as the cap, which ensures that moves constrained by 12–24 month non-competes are not lost. A 180-day window (the standard in labour mobility studies) would miss nearly 40% of IB→HF transitions and 28% of HF→HF transitions that occur in the 6–24 month gap range. Using 730 days adds 39% more observed transitions overall compared to 180 days.
Despite its informational value, flow covers only approximately 1% of all pairs. The vast majority of the network topology derives from Jaccard and embedding. Flow is most valuable for identifying and ranking the most competitive specific relationships, not for defining the network boundary.
Signal 3 — Embedding Cosine Similarity: semantic competition
We generate a short description of each firm using Claude, embed all 4,576 descriptions with all-mpnet-base-v2 (768-dimensional SBERT), and compute pairwise cosine similarity. This semantic signal adds value for firms whose regulatory footprints differ but whose business is clearly similar: two quant funds that may hold different RA combinations but describe themselves in near-identical terms.
What each signal can and cannot see
| Jaccard (structural) | Flow (revealed) | Embedding (semantic) | |
|---|---|---|---|
| Coverage | All pairs | ~1% of pairs | All pairs |
| What it captures | Regulatory overlap | Actual talent competition | Descriptive similarity |
| Blind spots | Ignores strategy, client base, geography | Sparse; finite window misses very long career breaks | Depends on LLM description quality |
| Best use | Broad network topology, community detection | Ranking competitive intensity; validating specific relationships | Niche discrimination within broad activity types |
A regression on 4,000 LLM-scored firm pairs confirms that the signals are complementary rather than redundant. SHAP feature importance:
| Feature | SHAP contribution |
|---|---|
| Jaccard similarity | 0.760 |
| Same firm type | 0.365 |
| Embedding similarity | 0.344 |
| Flow (normalised) | 0.014 |
The low SHAP for flow reflects that it is independent of what the LLM uses to judge competition: it measures revealed behaviour that is invisible to any structural analysis. Equal weights are an arbitrary design choice. Jaccard dominates the LLM-based regression, but flow and embedding each provide orthogonal signal that would be lost under SHAP-proportional weighting.
A few concrete examples of signal alignment and divergence:
| Pair | Score | Raw flow | Norm flow | Reading |
|---|---|---|---|---|
| Goldman Sachs / Morgan Stanley | 5.74 | 151 | 0.020 | Both signals align: canonical IB peers |
| UBS / Credit Suisse | 5.42 | 179 | 0.045 | Both signals align: full-service bank peers |
| Penjing Asset Management / Sigma Capital | 6.16 | 18 | 0.455 | Highest normalised flow in the dataset: two small AM firms with intense bilateral exchange relative to size |
| CMB International / CMBC International | 6.39 | 0 | 0.000 | Two distinct Chinese bank-affiliated IB arms with near-identical activity profiles; genuine competitors, zero observed talent crossing |
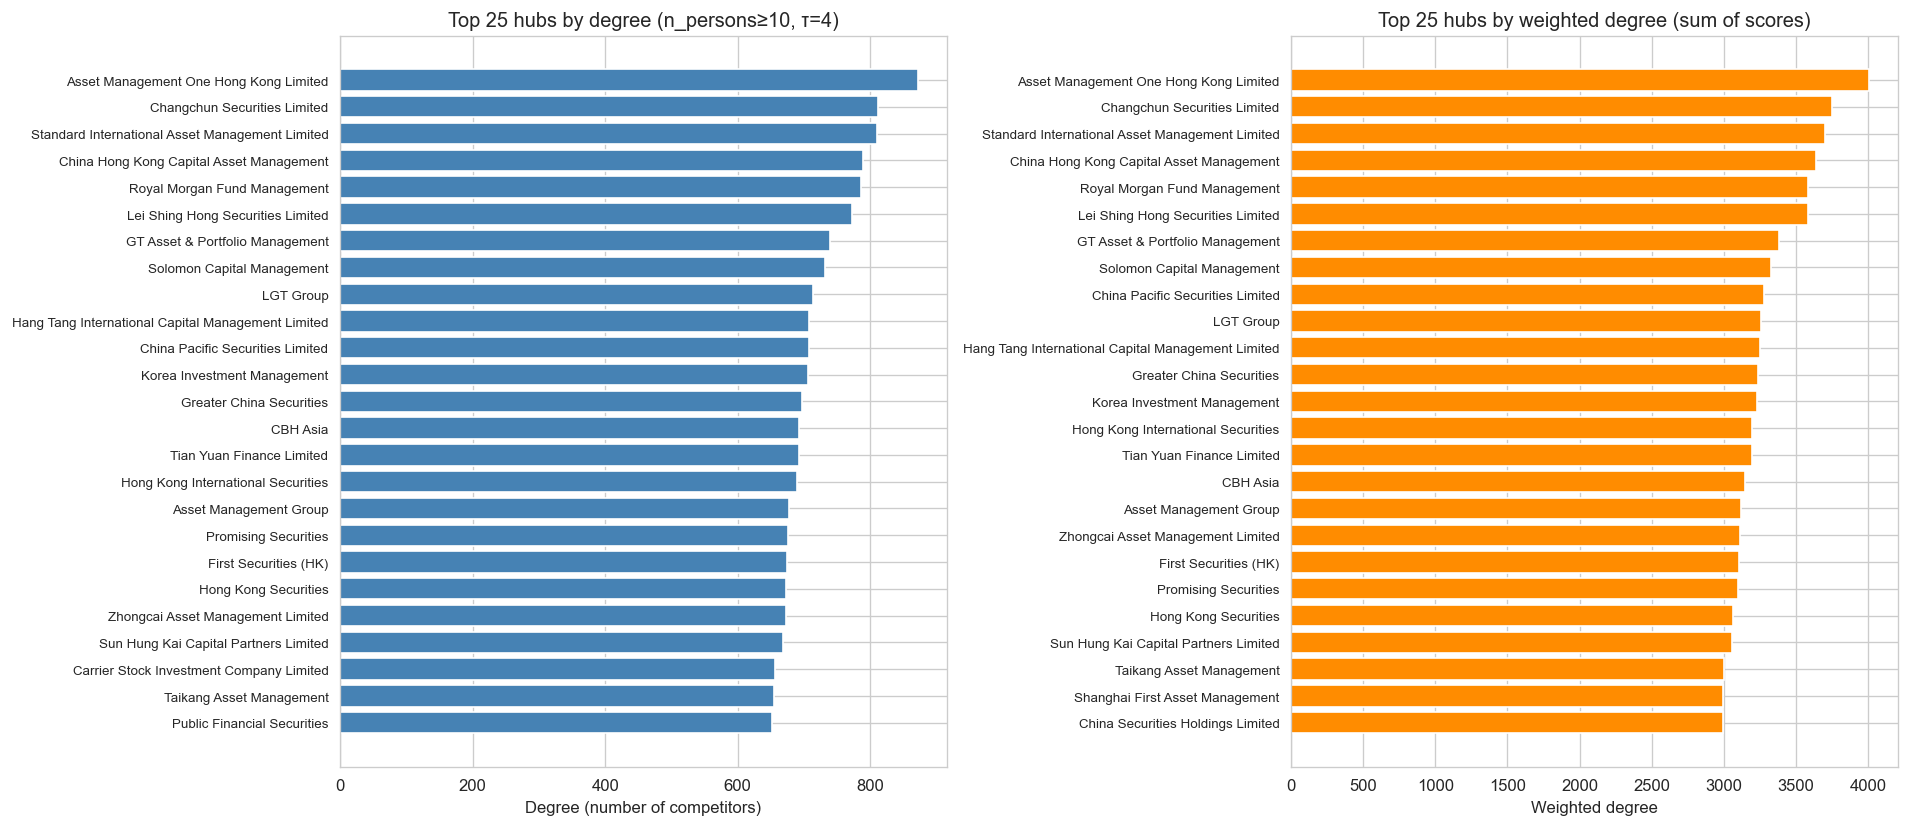
Network structure: 14 communities, modularity 0.622
Applying a minimum firm size of 10 persons and competition score threshold τ=4, the network has 2,387 nodes and 317,850 edges. Louvain community detection (modularity=0.622) finds 14 communities:
| Community | Size | Representative members | Interpretation |
|---|---|---|---|
| 0 | 706 | Goldman Sachs, Morgan Stanley, UBS, BofI Securities | Full-service investment banks and their execution arms |
| 1 | 412 | HSBC, Bank of China, ICBC, Orient Securities | Bank-affiliated commercial banks and their securities arms |
| 2 | 391 | Phillip Securities, KGI, Guangdeng Futures | Retail broker-dealers and futures intermediaries |
| 3 | 256 | Point72, Citadel, Balyasny, Millennium, BFAM | Hedge funds |
| 4 | 208 | Zhongtai International, ICBC International Securities, CCB International | China-affiliated mid-tier investment banks |
| 5 | 122 | Phillip Capital, Haitong International Futures, BofI Securities (formerly Merrill Lynch) | Futures-heavy broker-dealers |
| 6 | 102 | CPPIB, Computershare, smaller retail brokers | Smaller retail and custody-focused firms |
| 7 | 60 | Ping An, PricewaterhouseCoopers, Lego Corporate Finance | Insurance, audit, and corporate advisory |
| 8 | 53 | Zhongtai International Capital, RHB Capital, Fortune Financial Capital | Mid-tier regional banks and boutique IBs |
| 9 | 34 | FTL Wealth Management, Thornton Global, Wisdom Wealth | Independent wealth managers and IFAs |
| 10 | 28 | CES Forex, Emperor International Exchange, Rakuten Securities | Forex and retail FX platforms |
| 11 | 8 | S&P Global Ratings, Moody’s, Fitch | Credit rating agencies |
| 12 | 5 | Liquidnet, OSL Digital Securities, Hash Blockchain | Crypto and digital assets |
| 13 | 2 | Celestial Finance, Lei Shing Hong Finance | Residual micro-entities |
The modularity of 0.622 is high: communities are tightly internally connected and sparsely interconnected. Three global network properties are worth noting:
- Density = 0.127: 12.7% of all possible firm pairs exceed the competition threshold τ=4, relatively dense for an industry competitor network.
- Clustering coefficient = 0.825: if Firm A competes with B, and B competes with C, A almost certainly competes with C. Competition in financial services is highly transitive, as activity overlap propagates.
- Betweenness centrality: dominated by broker-dealers and mid-tier Chinese-affiliated firms, not the global investment banks. This is counterintuitive but structurally sensible: global IBs are so densely interconnected within their own community that they rarely serve as bridges. Local broker-dealers, with licences spanning retail, futures, and asset management, sit at the boundary between communities and act as connective tissue across the network.
Historical fingerprints: M&A, collapses, and market exits
The SFC register records every major institutional event that reshuffled Hong Kong’s financial workforce over two decades. Mergers, acquisitions, collapses, and strategic retreats all leave a characteristic signature: a concentrated burst of same-direction transitions within a narrow window.
| Year | From | To | Persons | Event |
|---|---|---|---|---|
| 2008 | Lehman Brothers | Nomura | 423 | Nomura acquisition of Lehman’s Asia-Pacific business |
| 2010 | Merrill Lynch | BofI Securities | 217 | Bank of America / Merrill Lynch integration and HK rebrand |
| 2017 | Tung Shing Securities + Futures | SinoPac Securities | 155 | SinoPac acquisition of Tung Shing’s HK brokerage |
| 2005 | Prudential Assurance | BOC International | 148 | Prudential restructured its HK securities operations |
| 2023 | Credit Suisse | UBS | 45 | UBS emergency rescue acquisition (March 2023) |
| 2012 | Royal Bank of Scotland | China Galaxy Securities | 39 | RBS exit from Asia, sold to Chinese state-owned buyer |
| 2012 | Crédit Agricole | China Galaxy Securities | 26 | Crédit Agricole’s HK business absorbed by China Galaxy |
| 2008 | Lehman Brothers | Neuberger Berman | 19 | Neuberger Berman (Lehman’s AM arm) carved out independently |
The 2008 Lehman event is the most dramatic in the dataset: 423 of 470 total Lehman to Nomura transitions occurred within the calendar year of the collapse. The 2012 entries reflect a structural shift, as RBS and Crédit Agricole both withdrew from Hong Kong and were absorbed by the same Chinese state-owned buyer, reflecting the broader retreat of Western banks from Asia operations in that period.
The Hedge Fund Ecosystem
Scale: 7,616 professionals, 6.2% of the register
Across the full 20-year register, 7,616 persons (6.2% of 121,883 total) held at least one licence at a hedge fund. The HF workforce has grown 14-fold since 2003 (182 to 2,543 active professionals by end of 2023):
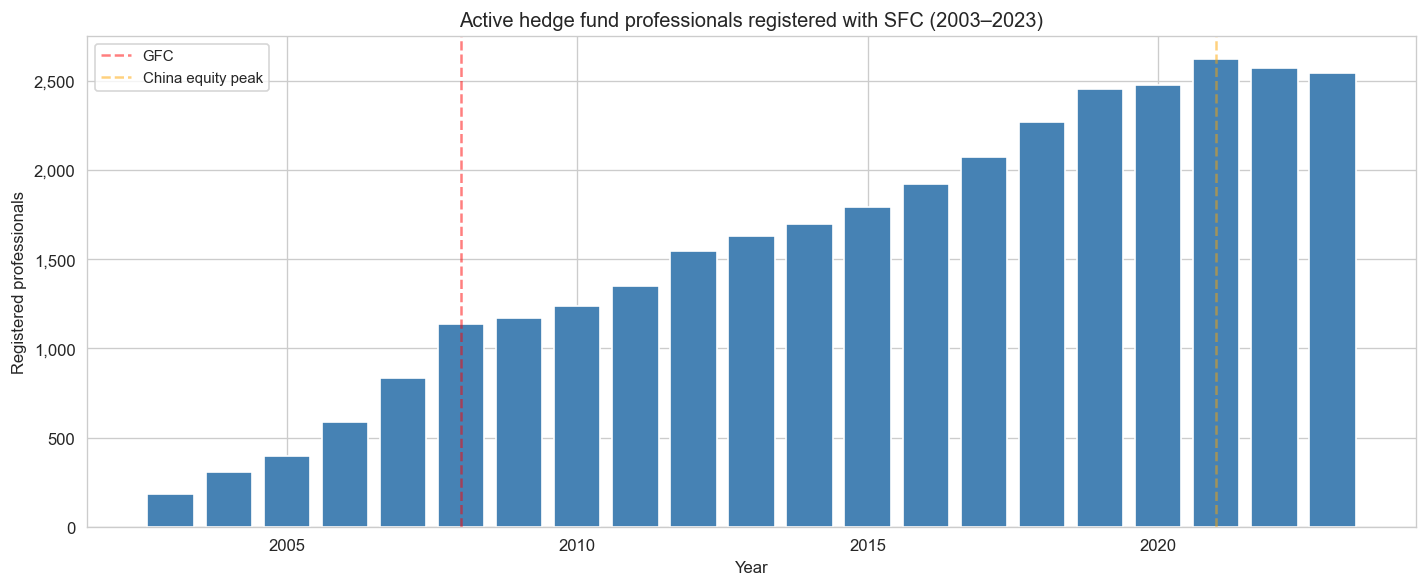
Growth was rapid through the 2000s (quadrupling 2003–2008), resilient through the GFC, and plateaued in 2022–2023. The plateau reflects several converging pressures: the prolonged China equity bear market from late 2021 onwards, regulatory actions affecting offshore China-focused funds, the unwind of leveraged macro China positions, and rising interest rates redirecting global LP capital away from Asia-focused alternatives. Note: 2024 is excluded as a partial year.
Identifying 315 hedge funds
The SFC has no “hedge fund” licence category. A fund running a long/short equity book and a Vanguard ETF product both hold RA9 (Asset Management). We classify all 1,113 firms in the asset manager / other / PE / wealth management categories using Claude Sonnet, with only firm name, Chinese name, and regulated activity types as input.
The result: 315 hedge funds identified. A second pass classifies each by primary strategy:
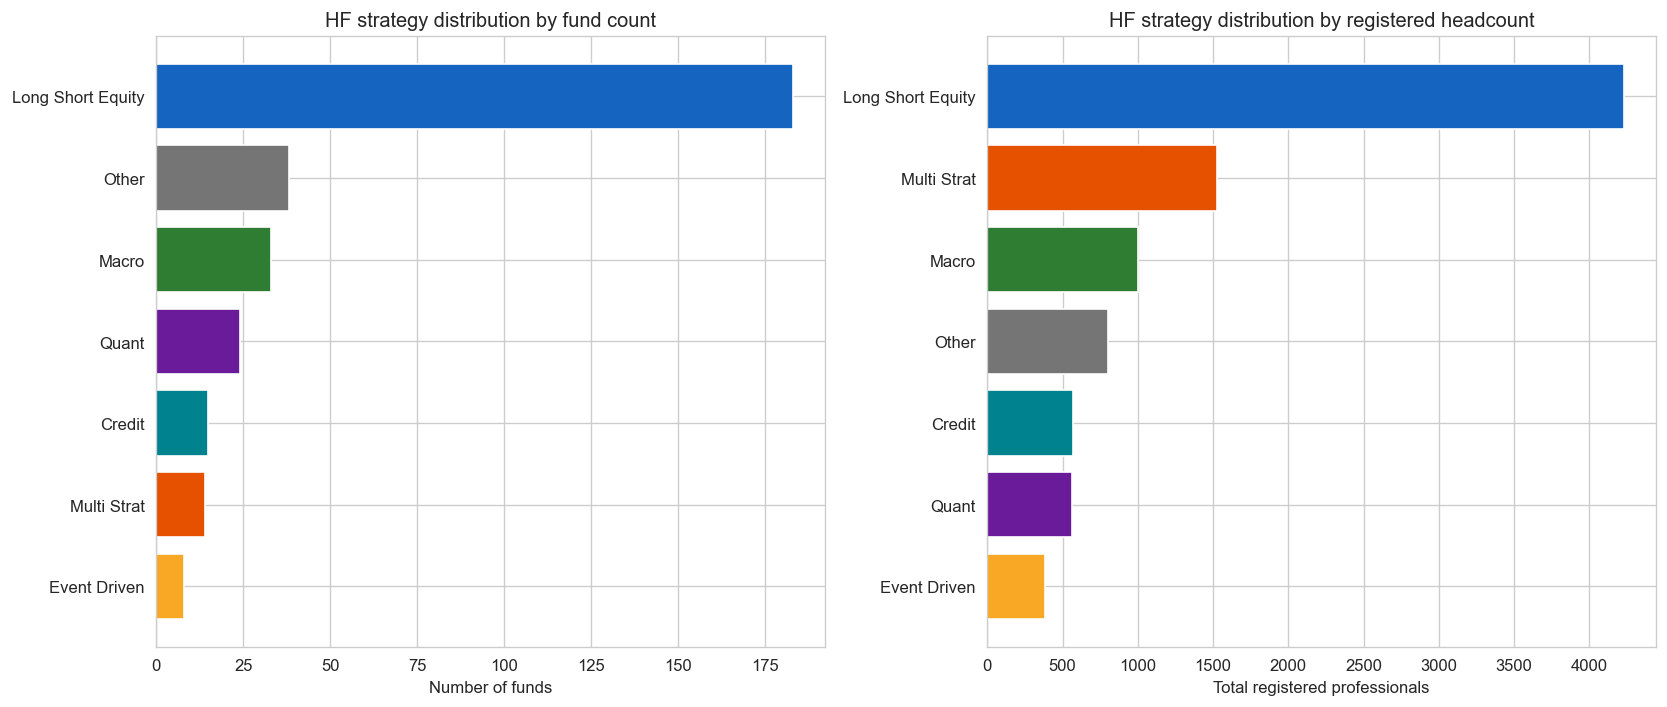
Long/short equity dominates by count (183 funds), reflecting Hong Kong’s role as the primary hub for Asia and China-focused equity strategies. Multi-strategy platforms are fewer (14 funds) but disproportionately large: Millennium (372), Point72 (295), and Citadel (259) are the three largest by registered professionals.
Survival: 244 active, 69 closed, median lifespan 10.5 years
Of the 315 HFs, 244 remain active and 69 have closed. The median lifespan of closed funds is 10.5 years: these are not failed startups but mature funds that ran their course. Closure rates are highest for 2006–2007 cohorts (44–60%), likely GFC casualties.
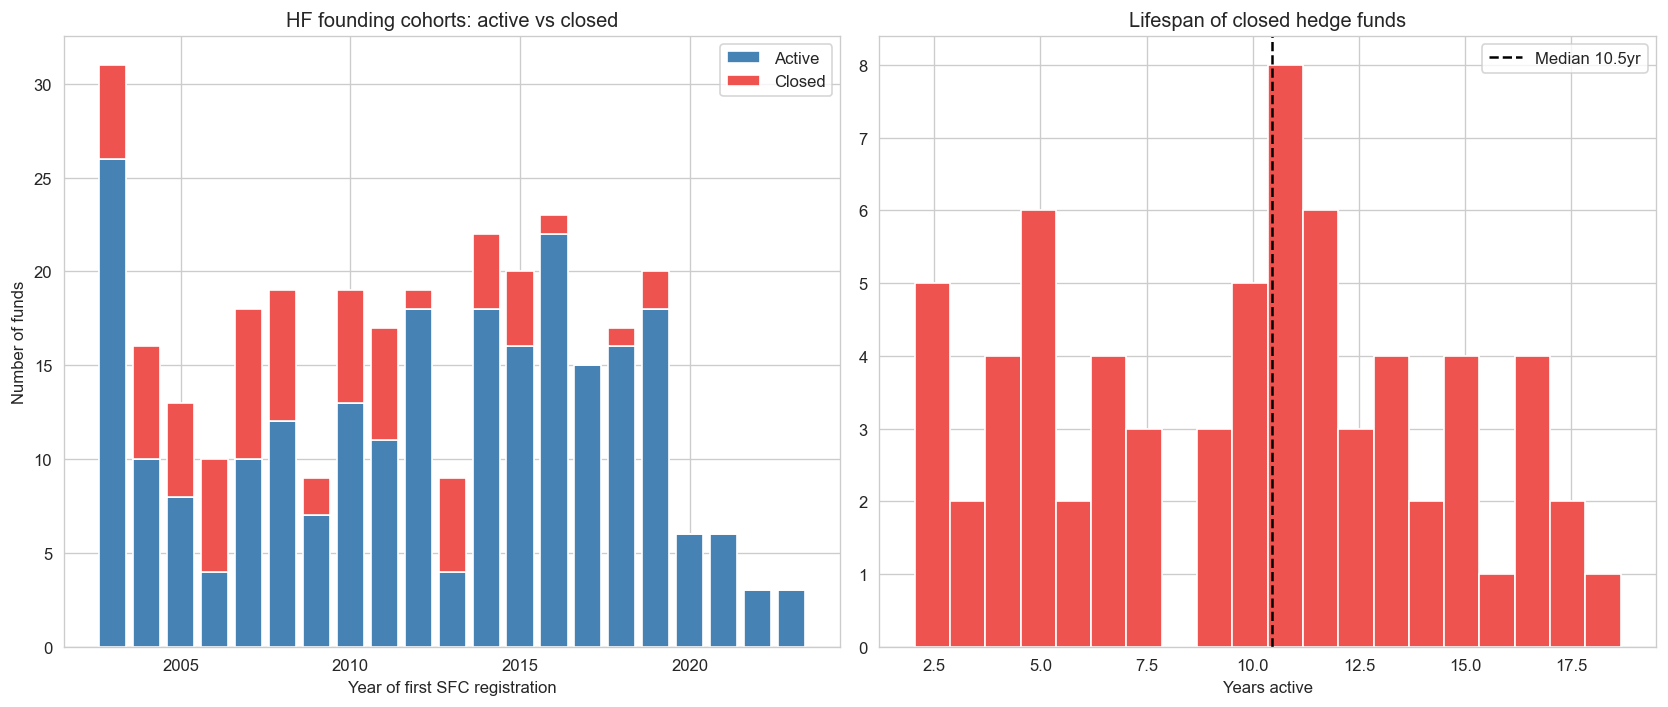
Among recent closures: Adamas Asset Management (2023, 10 years), Snow Lake Capital (2023, 11 years), Myriad Asset Management (2022, 11 years), and Azentus Capital Management (9 years).
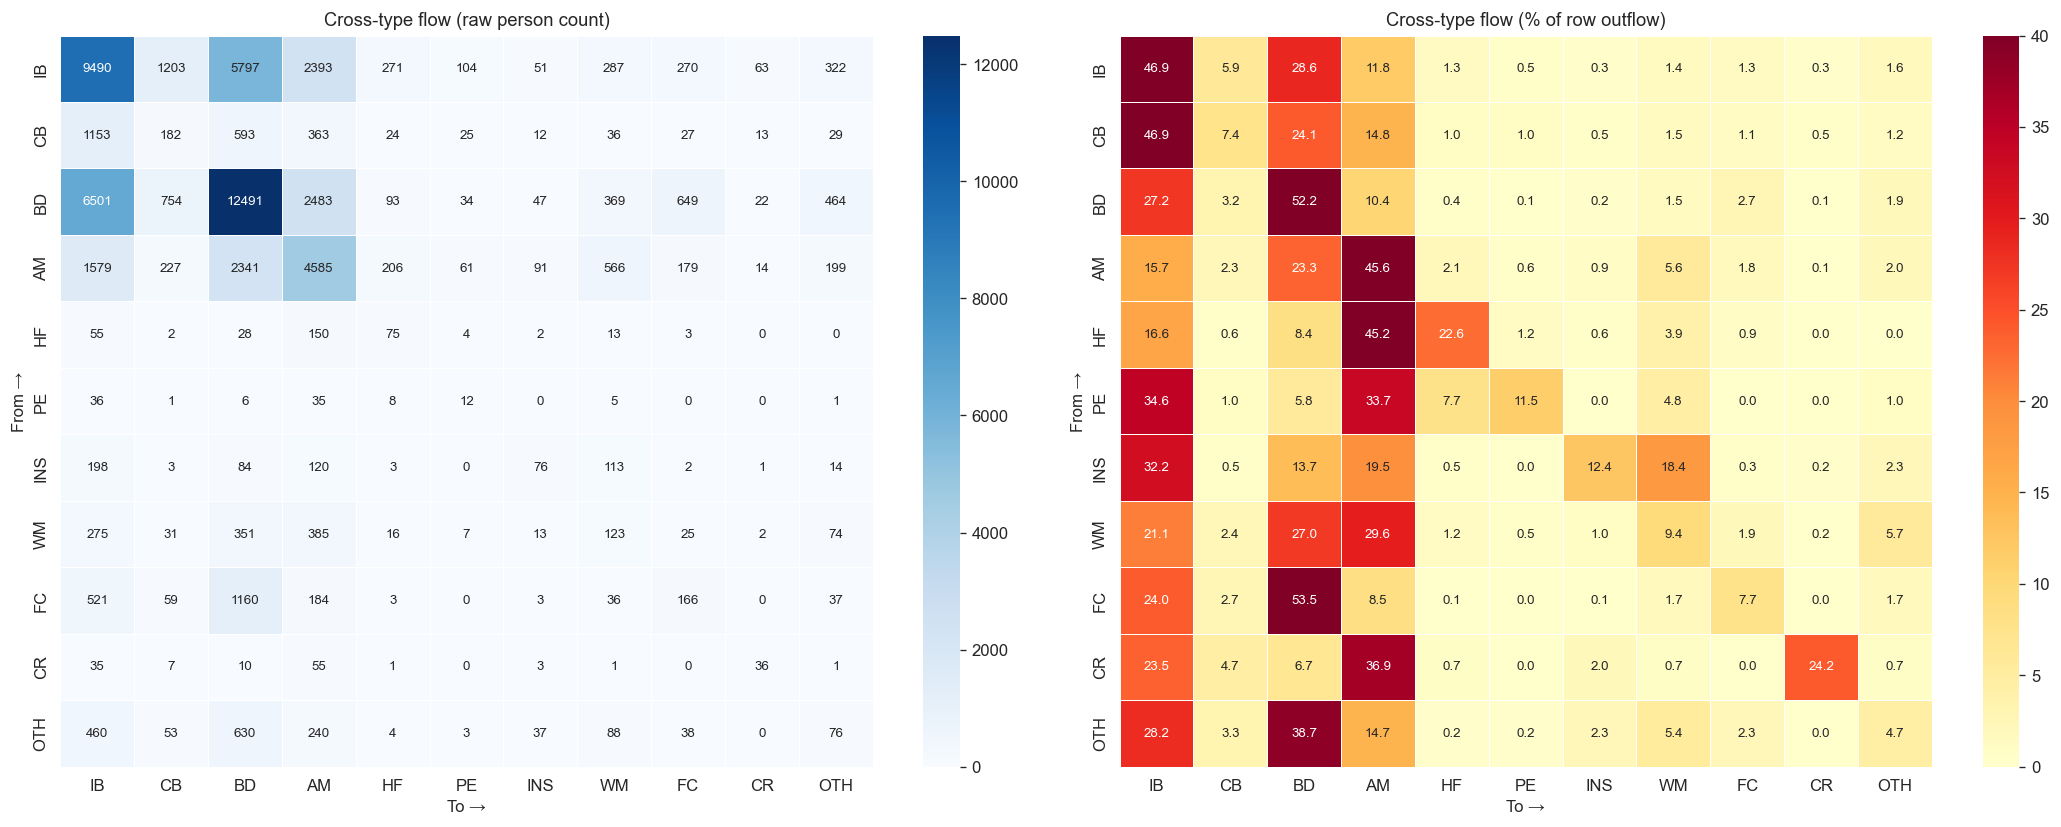
Goldman Sachs as training ground
Investment banks export talent to hedge funds at a 3.32× ratio relative to the reverse (1,271 IB to HF vs 383 HF to IB). This is career progression, not competition. Goldman Sachs sends 185 persons to hedge funds over the sample, the single largest feeder in the dataset, followed by Credit Suisse (158, combining all group entities), Morgan Stanley (127), Citigroup (77), JPMorgan (66), and UBS (64).
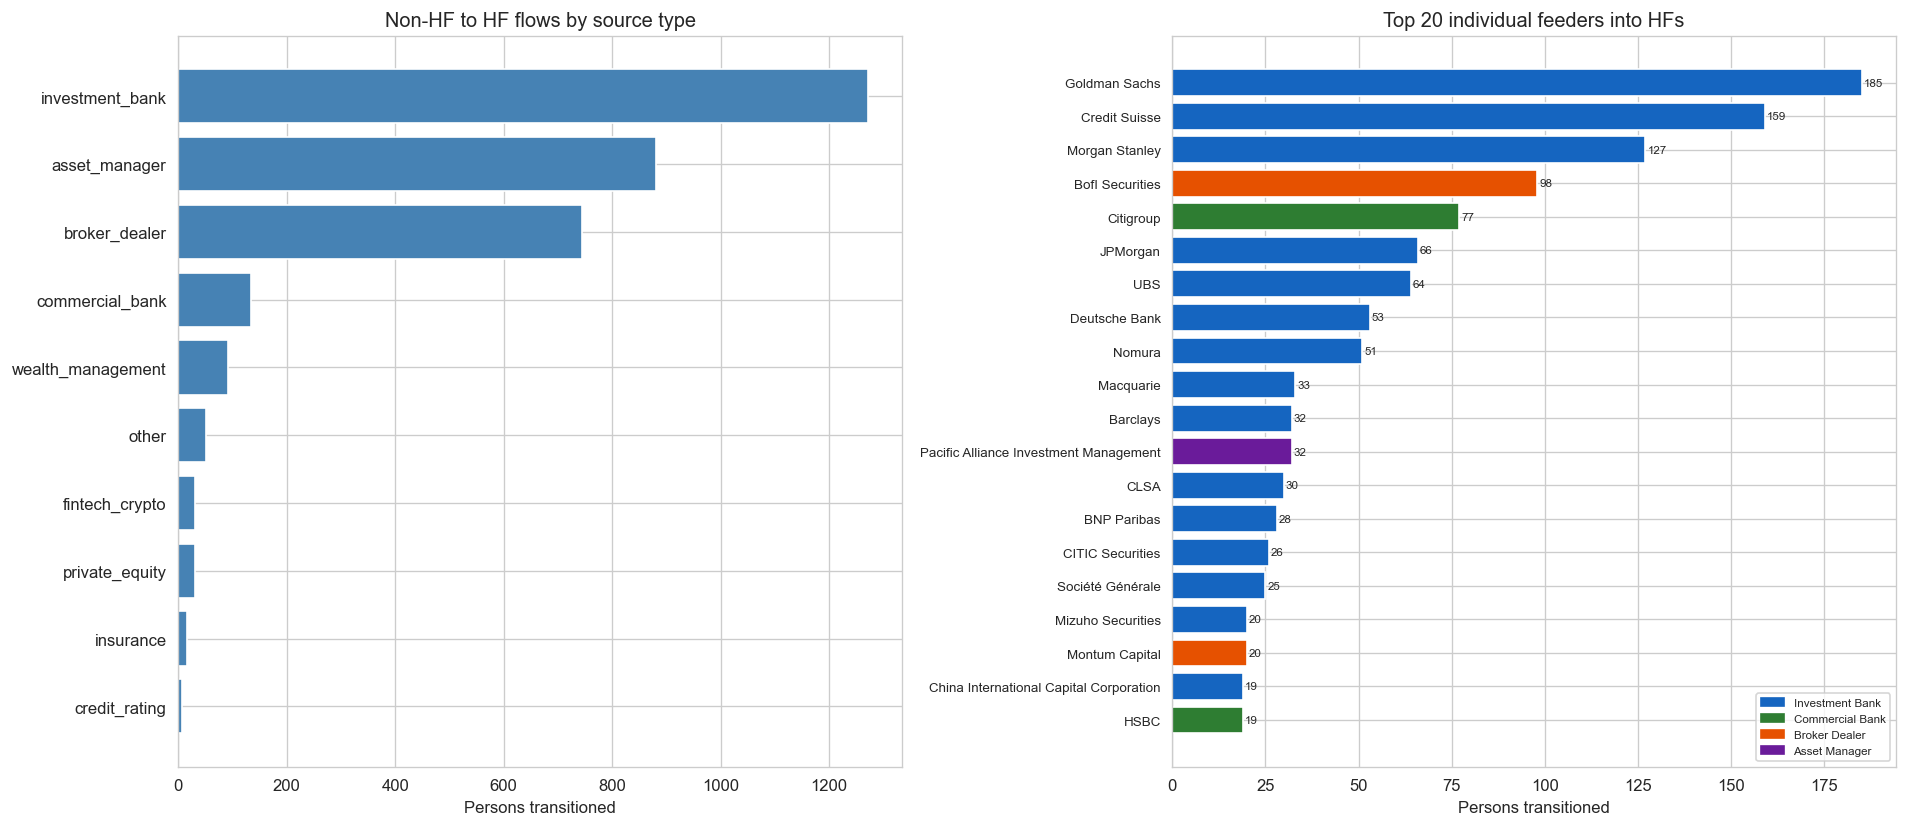
Investment banks lead with 30.4% of all HF inflows, followed by HF-to-HF moves (22.0%, covered in the next section), asset managers (21.1%), and broker-dealers (17.8%). The figure above shows only non-HF feeders; HF-to-HF transitions are analysed separately below.
The broker-dealer channel (17.8%, 745 persons) deserves attention. Broker-dealer professionals (equity sales traders, research analysts, derivatives structurers) move to hedge funds as execution talent: people who know how to work markets, manage relationships with prime brokerage desks, and execute strategies efficiently. These transitions tend to be faster, with a median non-compete gap of 79 days, shorter than IB to HF moves at 96 days.
HF-to-HF competition: the inner circle
918 persons transitioned between HF pairs over the 20-year sample (730-day window). The top undirected pairs:
| Firm A | Firm B | Persons |
|---|---|---|
| Adamas Asset Management | Gen2 Partners | 15 |
| Millennium Capital Management | Segantii Capital Management | 13 |
| Gentleman Capital | Goldhorse Capital | 13 |
| Millennium Capital Management | Polymer Capital | 12 |
| Millennium Capital Management | Point72 | 12 |
| Balyasny | Point72 | 11 |
| Dymon Asia | Millennium Capital Management | 11 |
| Balyasny | Millennium Capital Management | 10 |
The most active competitive cluster is the Balyasny–Millennium–Point72 triangle, the highest-weight triplet in the dataset. Millennium appears in more top bilateral flow pairs than any other fund, reflecting its model as a multi-PM platform with high hiring and attrition across the ecosystem.
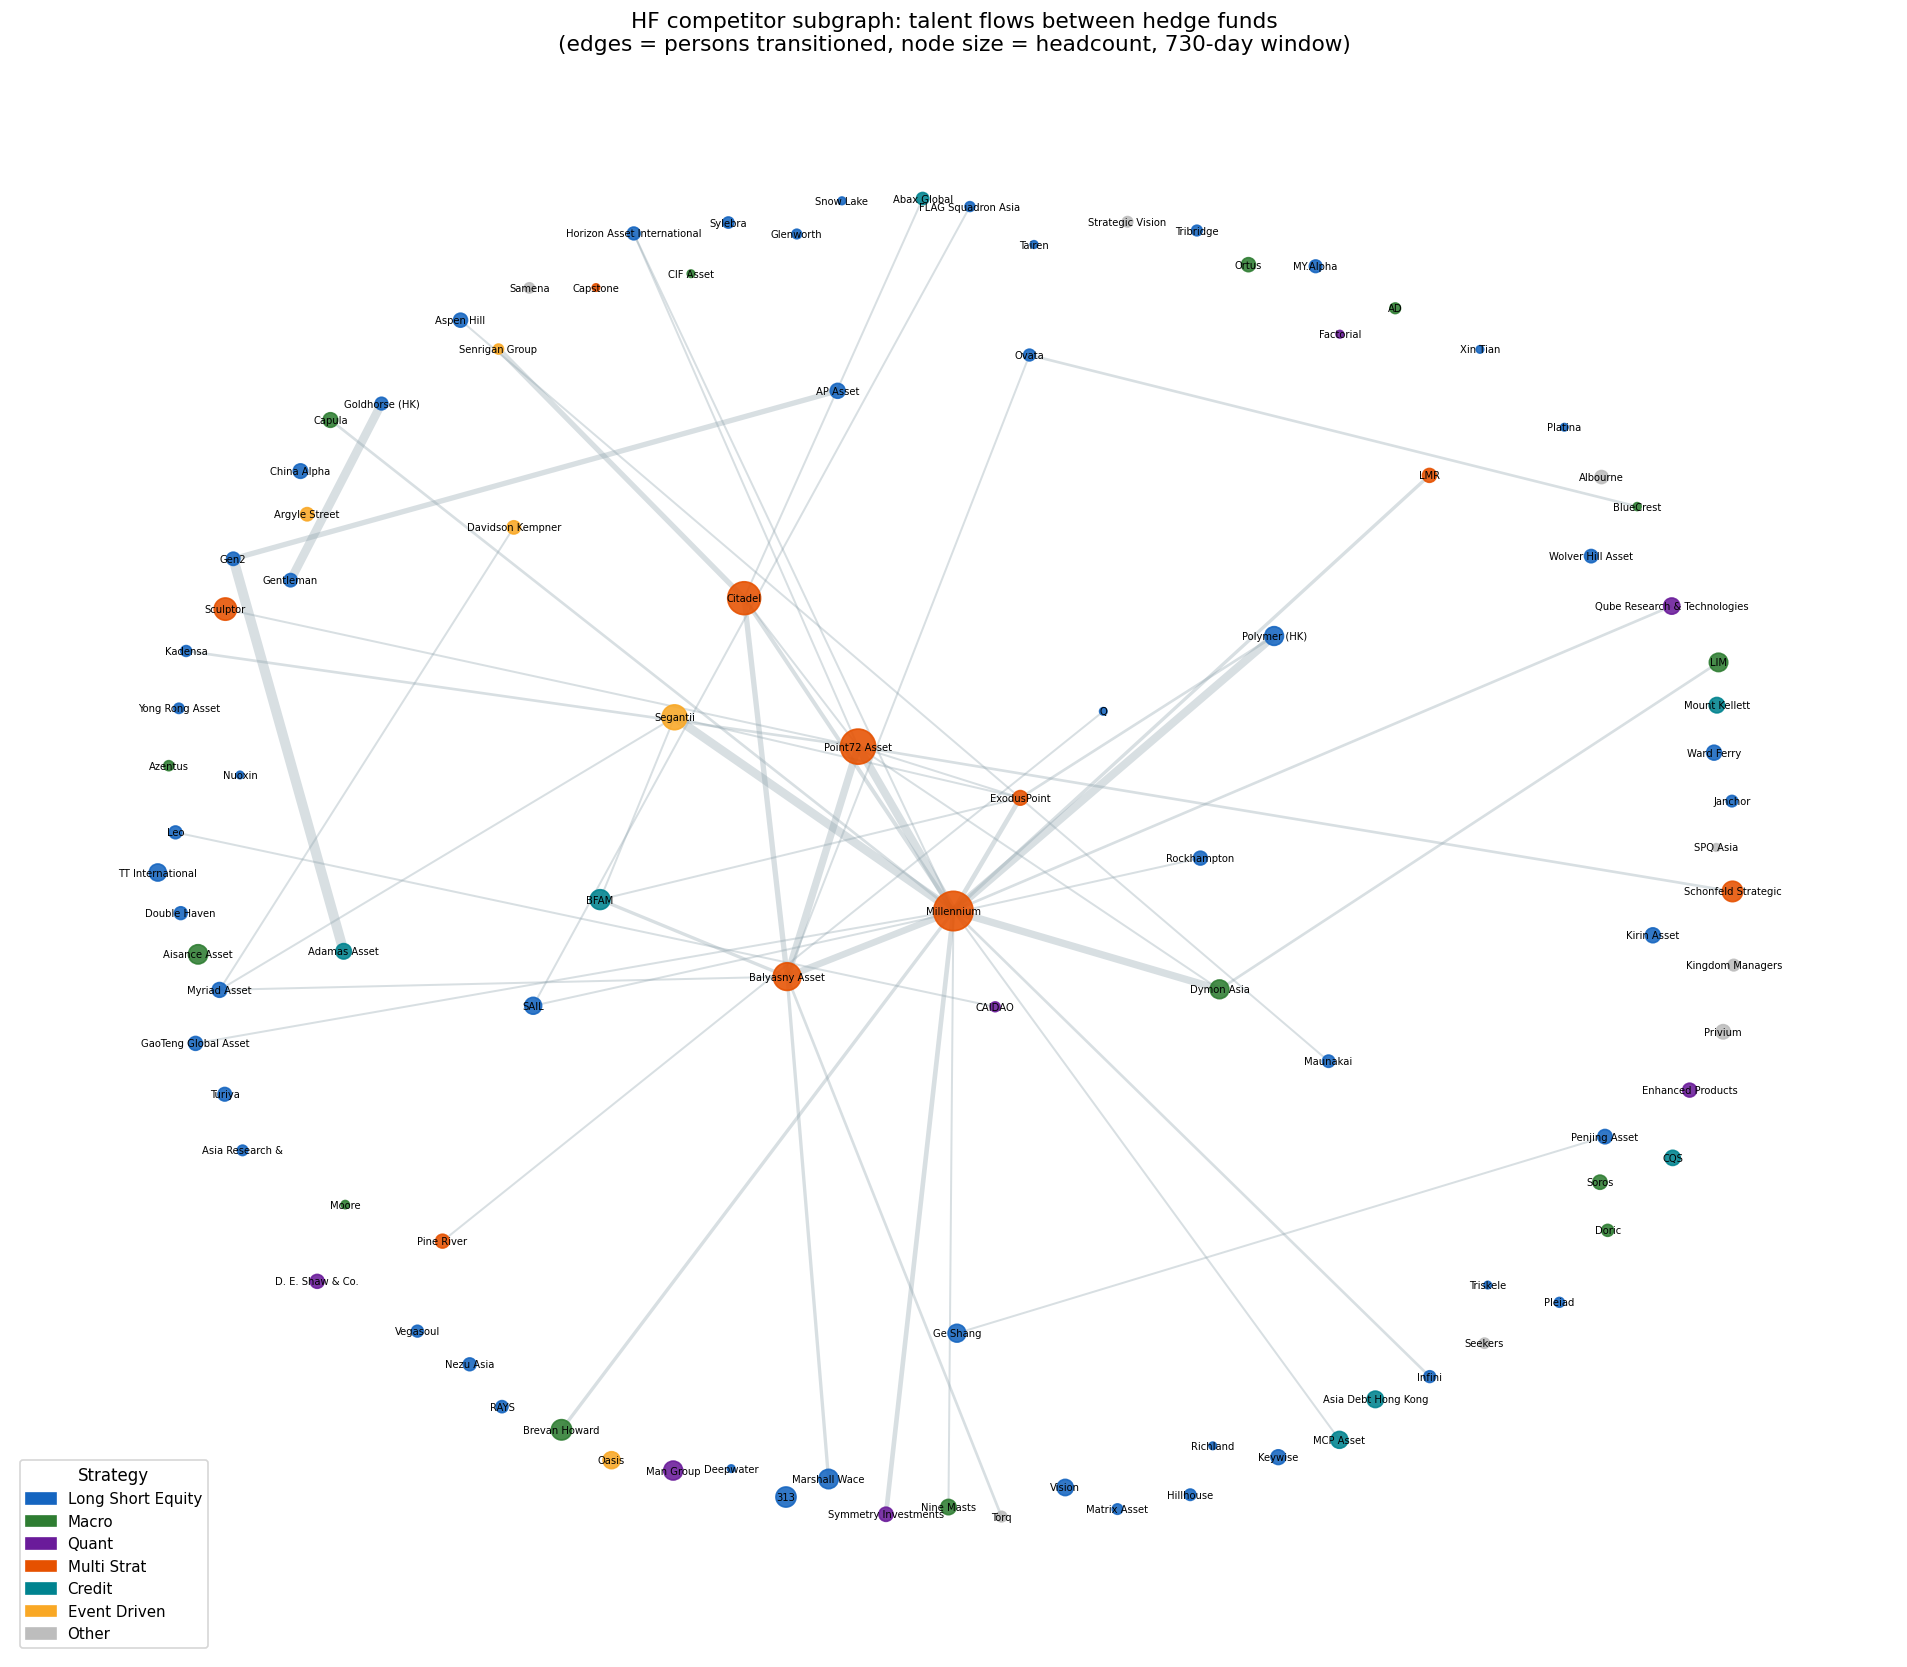
The network reveals two distinct competitive topologies. The global multi-strategy platforms (Millennium, Balyasny, Point72, ExodusPoint, Schonfeld) form a dense triangle core: they compete for the same PM talent pool, and the competition is mutual. The HK-homegrown funds (Gen2, Adamas, Gentleman, Goldhorse) show intense bilateral competition without triangular clustering, concentrated within strategy niches. Segantii is a hub-without-triangles: bilateral flows with 21 different funds spanning global multi-strats, macro, credit, and event-driven, consistent with an event-driven strategy whose talent pool overlaps many adjacent strategies.
Talent magnets and exporters
Net flow (inbound minus outbound HF→HF transitions) reveals a prestige hierarchy:
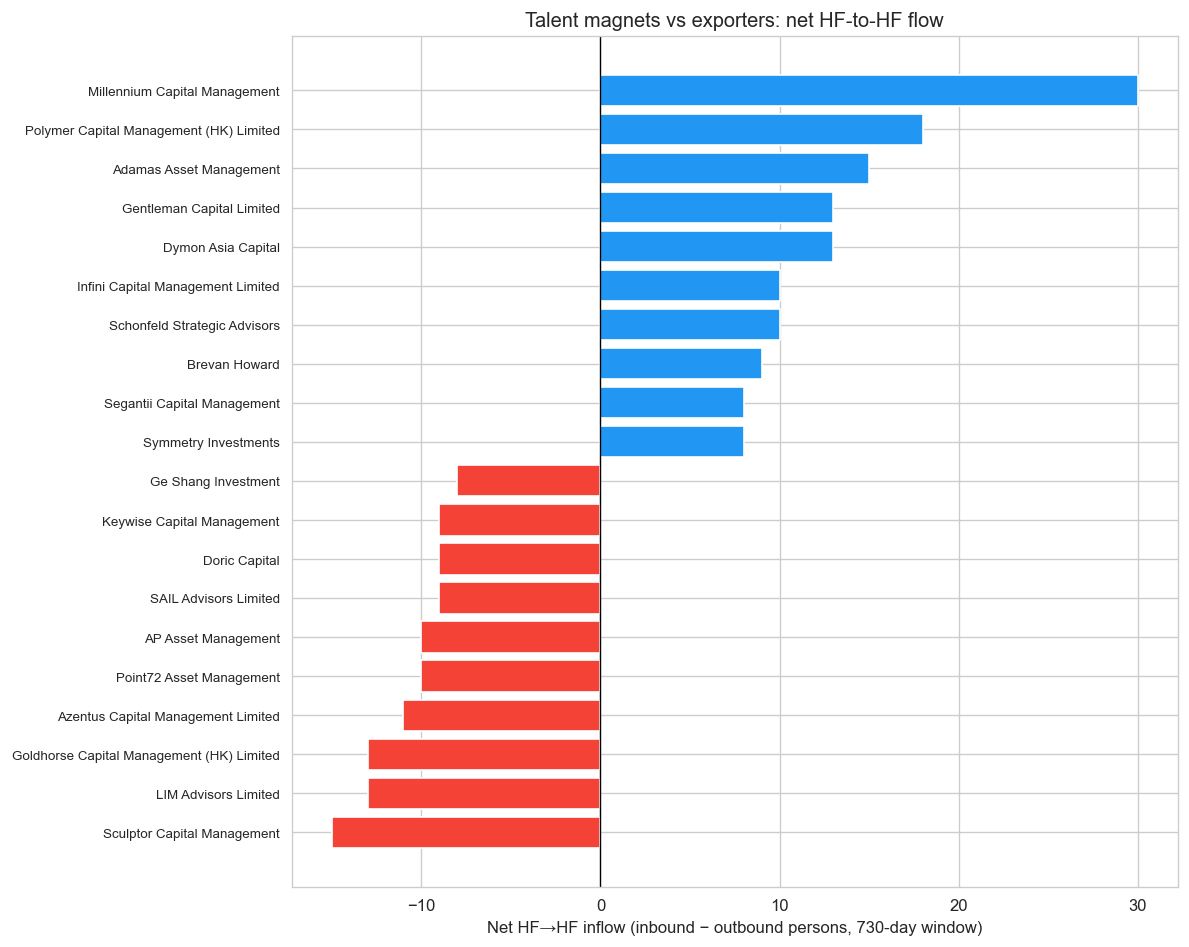
The strongest net importers are Millennium (+30), Polymer Capital (+18), Adamas (+15), Gentleman Capital (+13), and Dymon Asia (+13). Millennium’s dominance is striking: with 91 inbound and 61 outbound HF to HF moves, it is the platform of choice for experienced hedge fund professionals across strategies.
The largest net exporters are Sculptor Capital (−15), Goldhorse (−13), LIM Advisors (−13), Azentus (−11), and Point72 (−10). Several closed funds appear here, consistent with net outflow as a leading indicator of institutional stress. Point72 as a net exporter is notable: its single largest outflow destination is Millennium (10 persons), followed by Balyasny (6) and Schonfeld (4). PMs whose capital is reallocated typically move to another multi-strategy platform rather than exiting the industry. Point72 functions as a training and filtering ground within the multi-strat ecosystem.
Tenure: the whole industry is high-turnover
A common assumption is that hedge fund tenures are uniquely short and volatile. The data does not support this:
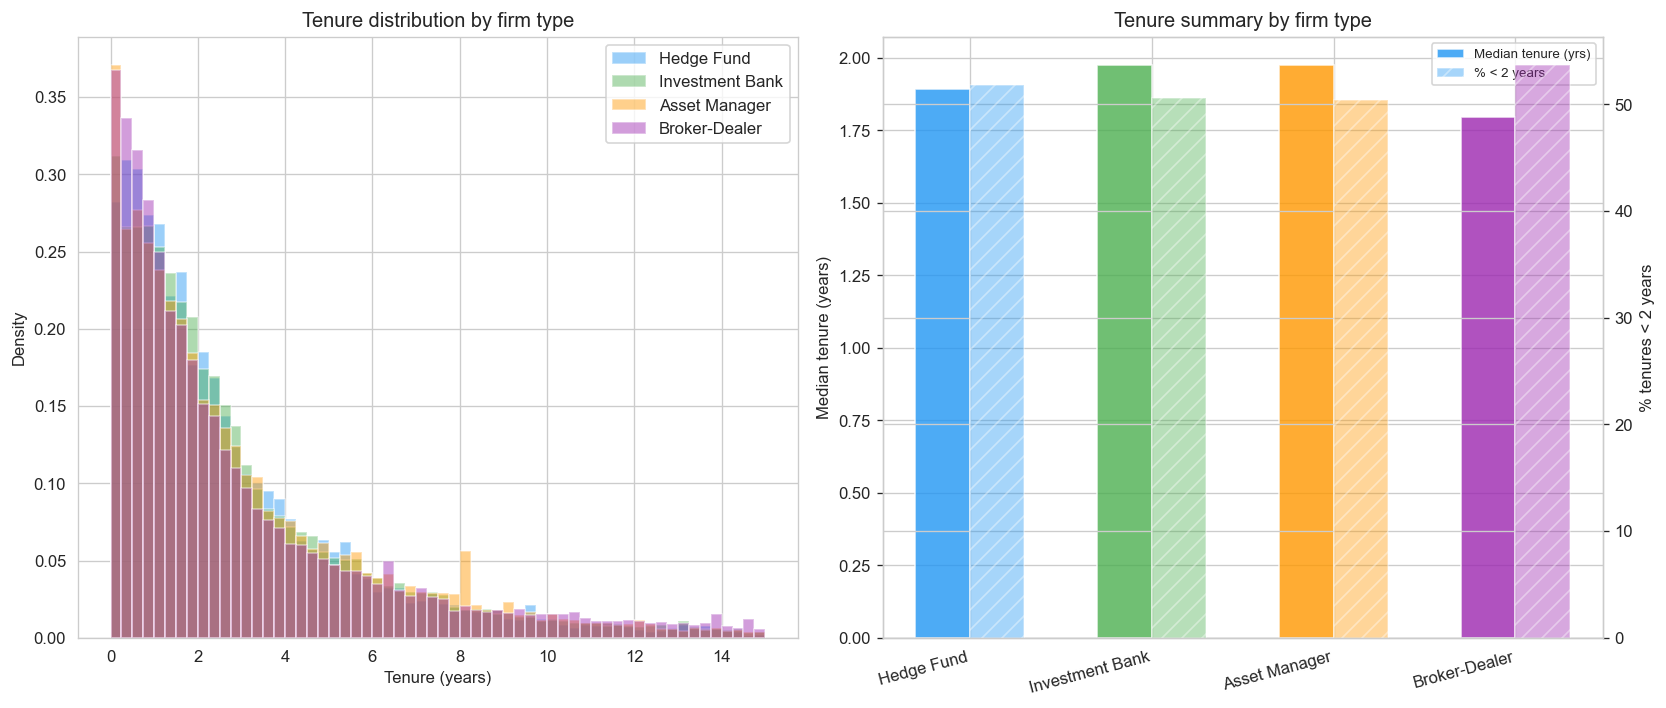
| Firm type | Median tenure | <1 year | <2 years |
|---|---|---|---|
| Hedge Fund | 1.9 years | 29% | 52% |
| Investment Bank | 2.0 years | 28% | 51% |
| Asset Manager | 2.0 years | 29% | 50% |
| Broker-Dealer | 1.8 years | 33% | 54% |
Median tenures are nearly identical across all firm types. The entire Hong Kong financial industry is a high-turnover labour market.
Two caveats on interpretation. First, SFC records are at the legal entity level: a professional who spends eight years at Goldman Sachs may appear as two or three separate tenures across different Goldman Sachs entities, compressing apparent tenure. Second, SFC-registered roles are disproportionately front-office and senior (portfolio managers, traders, analysts, relationship managers), roles with structurally higher turnover than back-office functions.
The gap between roles: where non-competes show up
When a professional leaves one firm and joins another, the gap between their last licence deactivation and next licence activation reflects the nature of the move.
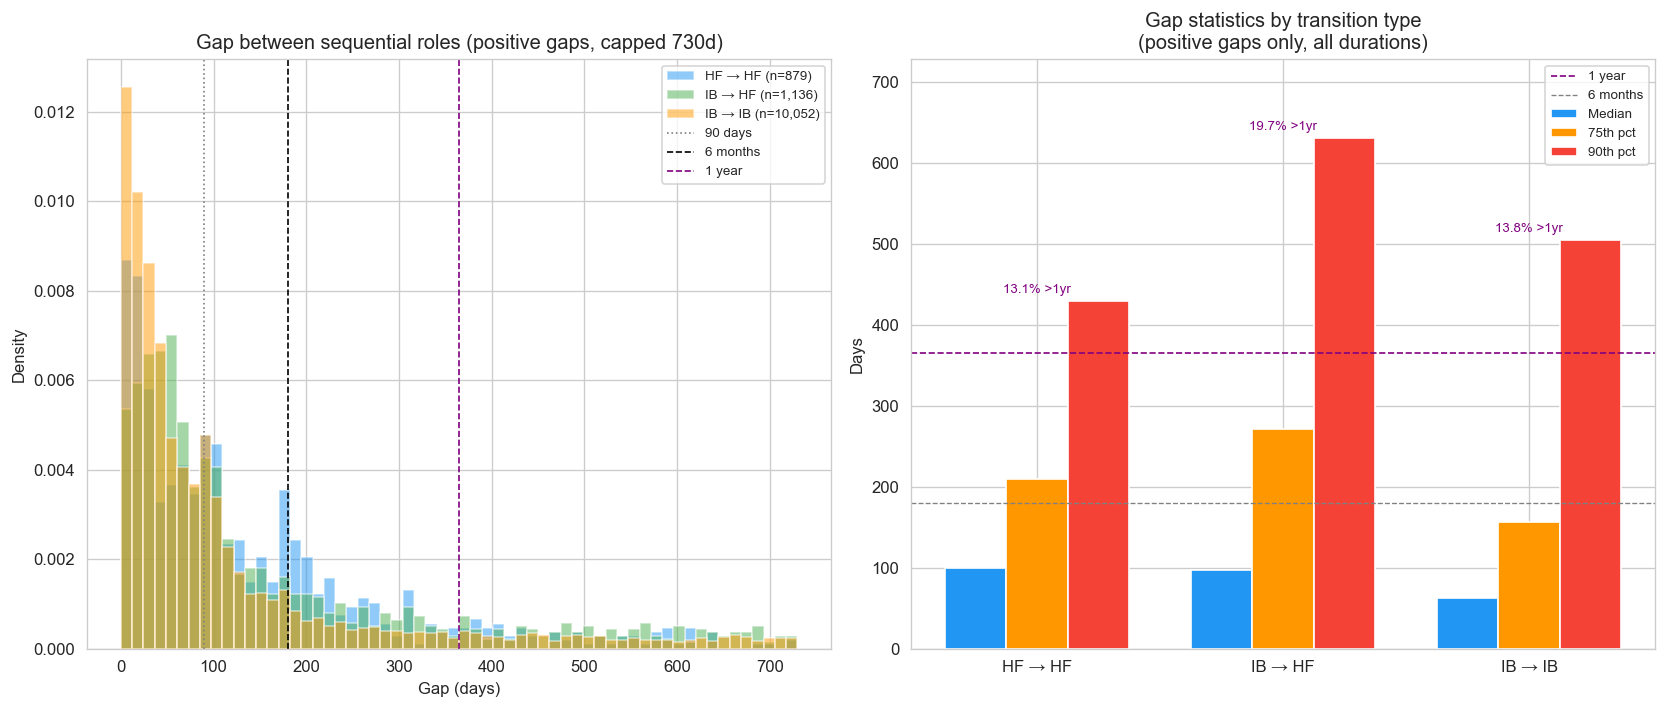
| Transition | Median gap | >180 days | >1 year |
|---|---|---|---|
| IB to IB | 62 days | 22.3% | 13.8% |
| BD to HF | 79 days | 27.1% | 16.2% |
| IB to HF | 96 days | 33.5% | 19.7% |
| HF to HF | 100 days | 31.7% | 13.1% |
(Positive gaps only, transitions capped at 3 years.)
The medians are broadly similar across transition types, ranging from 62 to 100 days. The fraction waiting more than a year varies more: IB to HF stands at 19.7%, compared to 13.1% for HF to HF. Whether this reflects more aggressive IB non-compete enforcement on buy-side departures, or other factors such as more senior roles being involved in IB to HF moves, is difficult to disentangle from this data alone.
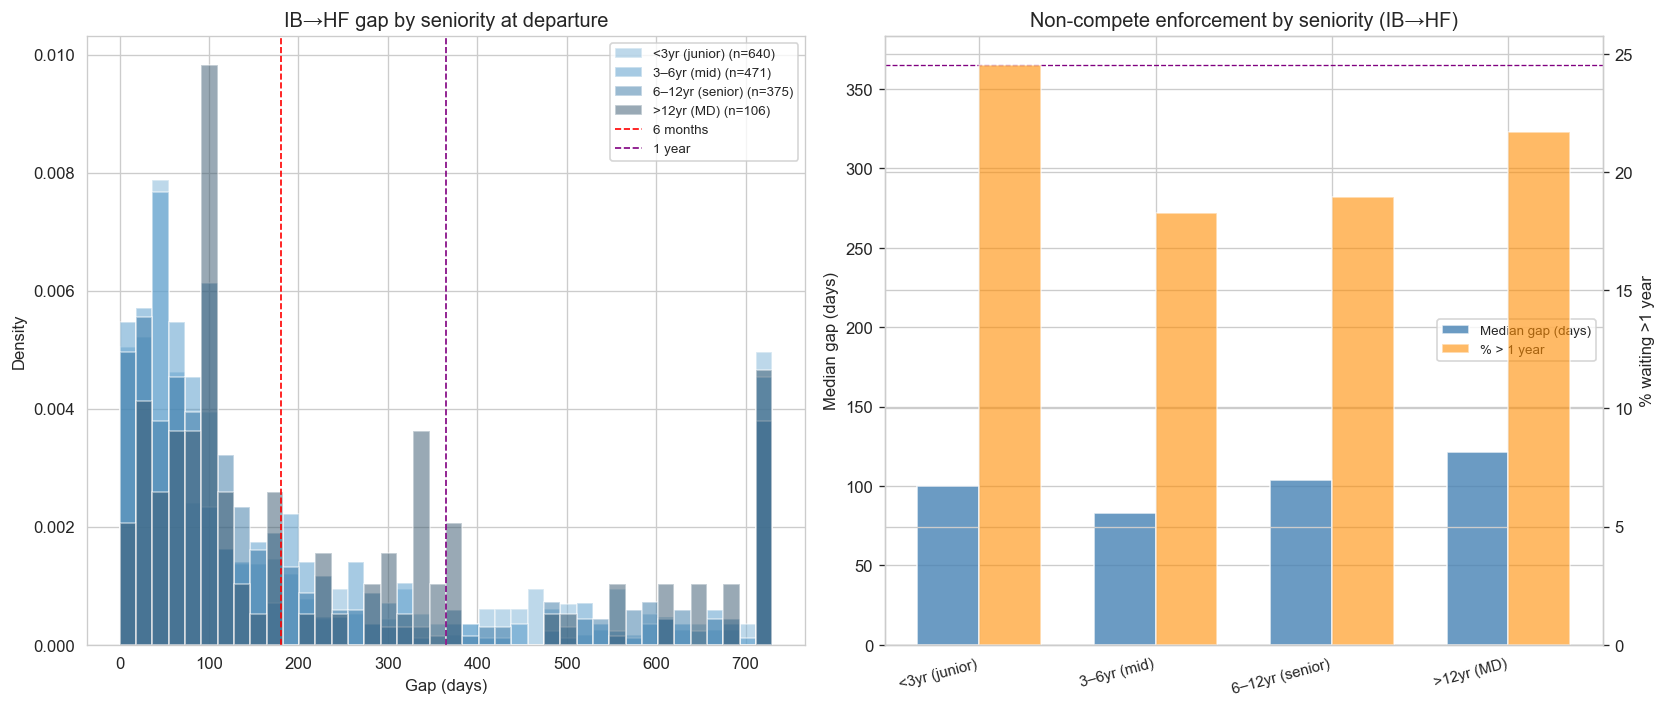
Breaking down IB to HF transitions by SFC experience at departure does not show a simple seniority gradient. The >1 year fraction is 24.5% for the least experienced tier and 21.7% for the most experienced, with mid-career professionals (3–6 years SFC experience) showing the shortest gaps at 18.3%. This is consistent with the SFC experience measure being a lower bound: international hires with prior careers outside Hong Kong appear junior by this metric even when they are in fact senior. Given this ambiguity, the seniority breakdown should be read with caution.
HF to HF moves (100 days median) show a lower long-gap fraction (13.1%) than IB to HF. This partly reflects that a share of HF to HF transitions occur when a fund closes, circumstances where the former employer has no competitive interests to enforce.
Career trajectories: how much experience before the HF?
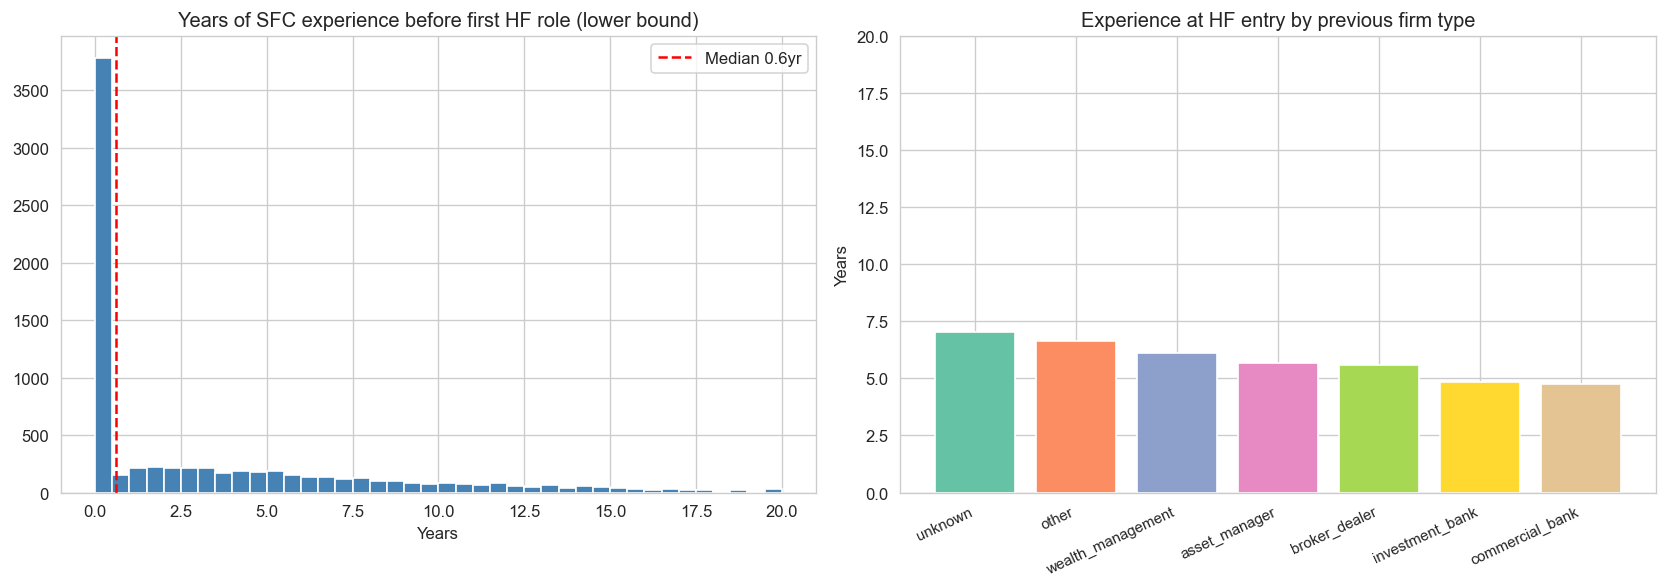
For the 7,616 persons who ever joined a hedge fund, 48.8% have no prior SFC record. This reflects several situations: fresh graduates recruited directly by funds, foreign hires whose prior careers were in other jurisdictions, and professionals coming from roles in Hong Kong that do not require SFC registration (quantitative researchers, for instance, are often not registered unless they hold a portfolio management role). Among those who came from other registered firms, median prior SFC experience ranges from 4.7 years (private equity) to 6.2 years (insurance), with IB professionals joining after approximately 4.9 years. All figures are lower bounds; the pre-2008 cohort is systematically undercounted.
Validation
Four consistency tests confirm the network captures meaningful competition:
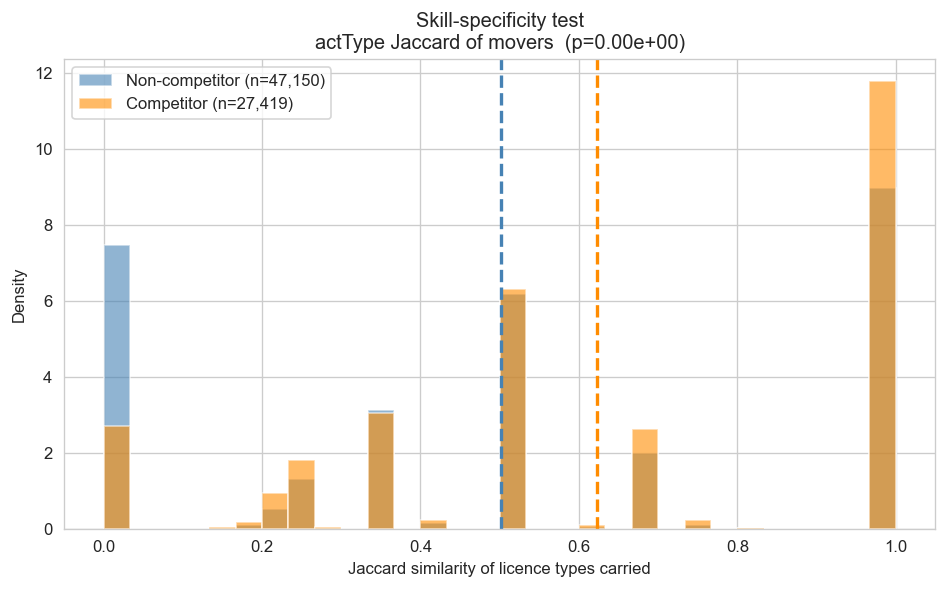
1. Skill-specificity: employees moving between competitor pairs carry significantly more similar regulated activity licences (actType Jaccard 0.62 vs 0.50; Mann-Whitney p≈0).
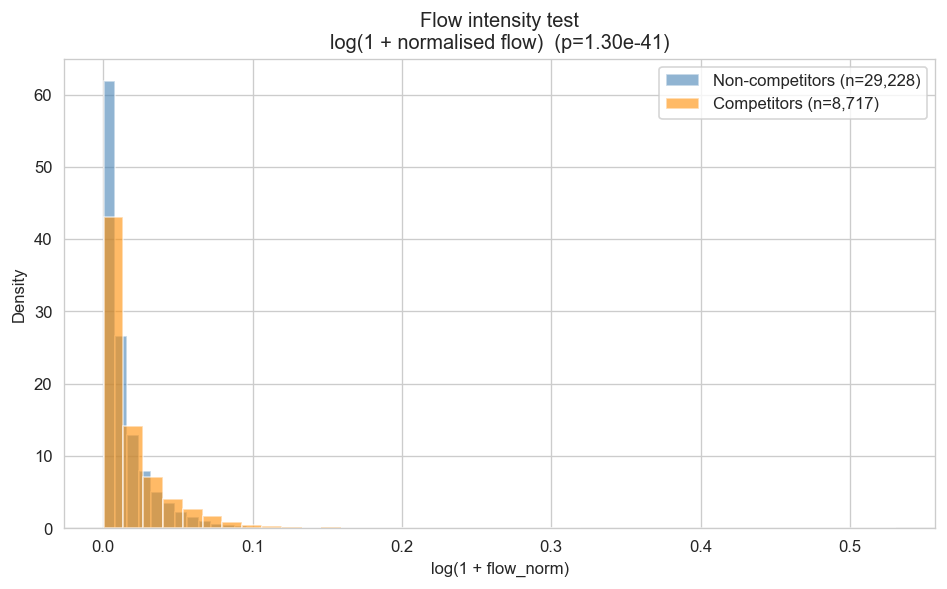
2. Flow intensity: competitor pairs have 1.4× higher normalised flow than non-competitor pairs (p≈10⁻²⁴). The signal is real but modest, with only approximately 1% of pairs having any observed flow.
3. Firm-type consistency: 52.9% of competitor pairs are the same firm type, vs. a 26.9% random baseline (χ²=109,254, p≈0).
4. Tenure signature: competitor-pair movers have longer pre-move tenure (701 vs 631 days median; p≈0), reflecting that movers to direct competitors tend to be more senior, and senior departures attract more scrutiny and longer notice periods.
Limitations
-
Career start lower bound: The register starts in 2003. Experience estimates are significantly downward-biased for professionals already in the industry by then.
-
730-day window: Chosen to capture non-compete-constrained flows. True multi-year career breaks are rare at the senior level and should not be counted anyway, so this window is a pragmatic rather than conservative choice.
-
HF classification at the small end: Some of the 315 HFs, particularly those with generic names and few registered professionals, may not be genuine hedge funds.
-
Embedded HF units: Strategies such as equity stat-arb units within large AM groups cannot be separated at the parent-entity level.
-
Absence of major quant funds: Several globally prominent quantitative funds (e.g. Squarepoint Capital) have no SFC-licensed entity in Hong Kong, possibly operating through Singapore. The quant segment is likely the most incomplete.
-
Team hires and spinoffs: Both Qube Research & Technologies (QRT) and Y-Intercept originated from Credit Suisse’s SMG group. QRT had 12 direct CS to QRT moves in 2018 alone. Y-Intercept shows only 4 direct CS to YI moves in the register; its founding team may have come from Credit Suisse offices outside Hong Kong, which would leave no HK SFC record.
-
Selective registration: Quantitative researchers may or may not be SFC-registered. Some firms reportedly de-register research staff precisely because licence records are public and signal headcount changes to competitors.
-
Static analysis: All results use the full 2003–2024 window. Year-by-year tracking of how competitive relationships form and dissolve is the natural extension.
Conclusion
Twenty years of regulatory data from Hong Kong’s SFC reveals a rich competitor network that no commercial data provider currently constructs. Labour mobility is a behavioural signal of competition, but the signal must be read carefully. Not every move is a defection.
Key findings:
- The HK financial competitor network has 14 communities (modularity=0.622) with clear alignment to firm type; betweenness centrality is dominated by broker-dealers, not global IBs
- Investment banks are training grounds, not competitors: Goldman Sachs sends 185 persons to hedge funds over 20 years, the most of any single institution, followed by Credit Suisse (158) and Morgan Stanley (127)
- 315 hedge funds identified (244 active, 69 closed); Millennium appears in more top bilateral flow pairs than any other fund, defining the competitive core of the multi-strategy ecosystem
- IB to HF transitions show the highest fraction of moves exceeding one year (19.7%), with plausible explanations including non-compete enforcement on senior buy-side departures and the seniority profile of these moves; HF to HF stands at 13.1%
- 48.8% of HF entrants have no prior SFC record, reflecting direct recruitment from graduate programmes, overseas hires, and professionals coming from roles not requiring SFC registration
The methodology is fully reproducible from the SFC public register. A prepared extract of the register is available as a public dataset on Kaggle. The academic paper is in preparation.
This work builds on Mapping Hong Kong’s Financial Ecosystem and Turnover Contagion in HK Financial Labour Markets.
This is an academic research project conducted in collaboration with Abdulla Al Ketbi, in the context of his PhD research on complex networks, explainable AI, and complexity science. The results presented here are preliminary and will be incorporated into his PhD manuscript and associated publications. This post does not constitute investment advice and has no connection to any employer or commercial entity.